Pressure monitoring in water networks: Early fault detection
2/3 | Water pressure monitoring as a key tool for early fault detection. The second article in a three-part series on water losses in distribution networks and how to reduce them, produced in cooperation between ACRIOS Systems and Lorenz GmbH & Co. KG. The first part mapped the scale and causes of water losses; this one focuses on how to detect them.
How does a utility know something is wrong?
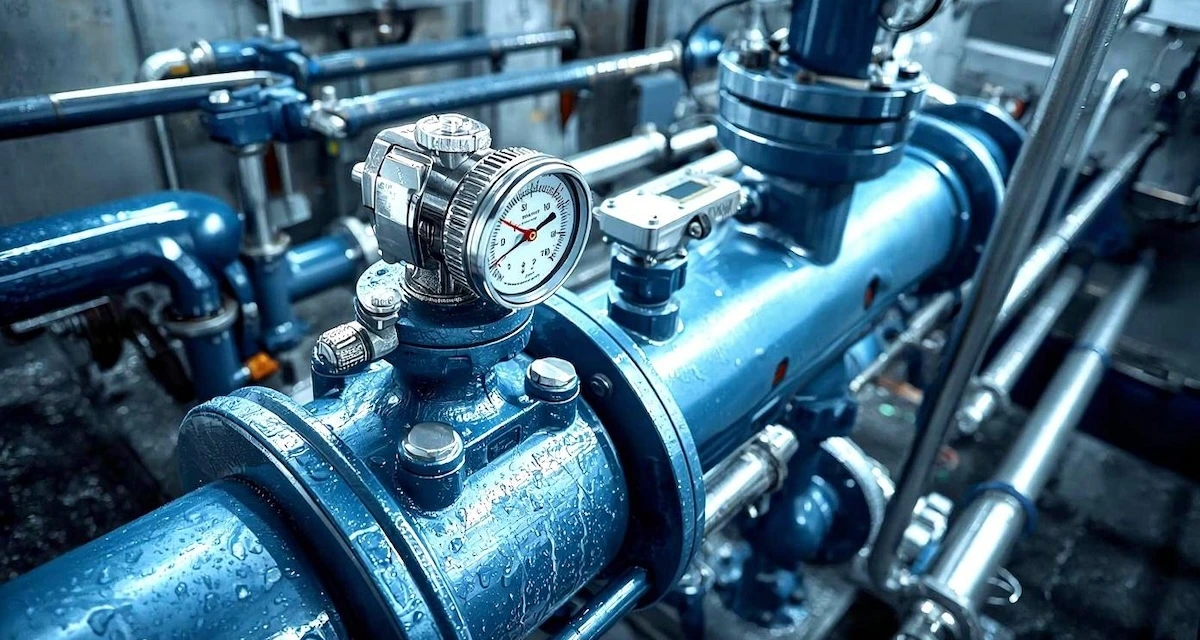
Imagine a water network as a closed hydraulic system under constant pressure. Under normal operating conditions, pressure at any given point in the network is predictable. It follows daily demand cycles, rises at night when consumption drops and falls during morning and evening peaks. The system behaves within a known envelope.
Now imagine a crack opens in a pipe. Water escapes. The pressure at nearby points drops, subtly at first, then more sharply. If the leak grows, the signal strengthens. If it remains small, the pressure signature may be barely detectable against the background of normal demand variation.
The fundamental challenge of leak detection is extracting meaningful fault signals from a noisy, dynamic hydraulic system. Different technologies approach this challenge in different ways, with very different results.
Traditional leak detection methods and their limits
Acoustic methods
Acoustic detection is one of the oldest and most widely used leak-finding technologies. When pressurised water escapes through a crack or hole, it generates vibrations that propagate through the pipe wall and the surrounding soil. Trained technicians with listening sticks, or electronic loggers placed on hydrants and valves, can detect these vibrations and triangulate leak locations.
Acoustic correlators, devices that compare signals from two sensors placed at different points, can narrow down a leak's position to within a few metres on metallic pipework. The technology is proven and cost-effective for many situations.
But acoustic methods have real limitations. As research published in Water Research and by the Institute of Acoustics, Chinese Academy of Sciences confirms, they work best on metal pipes, where acoustic signals travel efficiently. On plastic pipes, which now make up an increasing proportion of distribution networks, attenuation is higher and signals are significantly weaker.
Acoustic performance also degrades in noisy environments such as city centres or near heavy traffic. And critically, acoustic surveying is inherently a point-in-time activity. A team surveys a zone, finds what is detectable at that moment and moves on. Small, slow leaks may simply not generate enough noise to be found.

District metered areas and water balance
District metered area management divides a network into discrete hydraulic zones, each with controlled inlet and outlet flows measured by meters. By comparing inflow to billed consumption, utilities can calculate the volume of water unaccounted for in each zone and prioritise investigation accordingly.
As detailed in the practitioner's guide "Losses in Water Distribution Networks" by Farley and Trow, DMA-based management is a powerful framework for understanding leakage at a network level. It enables systematic targeting of high-loss areas and supports night flow analysis, a technique that uses the minimum overnight flow rate to estimate background leakage, since legitimate consumption is at its lowest between roughly 2 and 4 am.
The limitation is scope and cost. Creating and maintaining DMAs requires investment in boundary valves, meters and communication infrastructure. In complex, heavily interconnected networks, hydraulic isolation can be technically challenging. And DMA analysis identifies zones where leakage is high, but it does not pinpoint where in those zones the leak is occurring.
Reactive maintenance and customer reports
In many utilities, particularly smaller ones or those operating in resource-constrained environments, leak detection is primarily reactive. The utility responds when a leak becomes visible at the surface, when a burst causes noticeable pressure loss or when a customer reports a problem.
Reactive maintenance is the most expensive way to manage leakage. By the time a leak is visible, it has typically been running for an extended period. Emergency repair disrupts customers, requires immediate mobilisation of teams and often results in higher costs than planned preventive repair would have done.
Continuous pressure monitoring: A different approach
Pressure monitoring does not replace acoustic methods or DMA management. It complements them. What it adds is continuous, real-time visibility of the hydraulic behaviour of the network, enabling a different class of fault signals to be detected.
What normal pressure looks like
Every network has a characteristic pressure profile. Pressure is highest at night, when demand is low and there is no drawdown from consumers. It is lowest during morning and evening peaks.
Pressure varies by zone depending on elevation, proximity to pumping stations and the configuration of pressure reducing valves. Once a baseline is established for each monitoring point, deviations from that baseline become meaningful.
The signals that matter
A continuous pressure logger, installed at a strategic point in the network and transmitting data every few minutes, can detect several categories of anomaly:
- Sudden pressure drops: a sharp fall in pressure at one or more sensors can indicate a pipe burst or a significant leak opening. The pattern of which sensors are affected, and by how much, can help narrow down the location.
- Gradual pressure decline: a slow, sustained reduction in baseline pressure over days or weeks may indicate a growing leak or a zone of increased consumption. This is difficult to detect in any other way without continuous data.
- Pressure transients: unexpected spikes or oscillations indicate hydraulic shocks in the system, for example water hammer events, rapid valve movements or pump trips. Repeated transients at a given location are a warning sign of future pipe fatigue and failure.
- Night-time minimum pressure: cross-referencing pressure data with minimum night flow data from DMA meters creates a powerful combined picture of where leakage is occurring and how it is evolving.
Scenario examples
Consider three practical scenarios that illustrate the value of continuous pressure data.
Scenario A: sudden burst
A pressure sensor in a residential zone records a pressure drop of 0.8 bar within two minutes at 3:15 am. A neighbouring sensor records a similar drop 30 seconds later. The operations centre receives an automated alert, dispatches a repair crew and the burst main is isolated within two hours, before any customer reports a problem and before significant road damage occurs.
Scenario B: slow leak
Over three weeks, the baseline overnight pressure at a particular point drops from 4.2 bar to 3.9 bar, a change that would be invisible without continuous logging. Night-flow analysis of the DMA meter shows a corresponding increase in background leakage. Investigation finds a corroded joint that has been slowly weeping for at least a month.
Scenario C: transient damage
A pressure transient logger records repeated spikes at a pumping station outlet every time the standby pump starts. Cross-referencing with maintenance records shows that a pipe section 200 metres downstream has experienced two unexplained failures in the past 18 months. The root cause, water hammer from a poorly configured pump start sequence, is identified and corrected, preventing a third failure.
Beyond detection: Pressure optimisation
Continuous pressure monitoring also enables a proactive strategy: active pressure management. Research consistently shows that pipe burst rates are strongly correlated with operating pressure. Specifically, reducing average network pressure reduces both the frequency and severity of failures.
A utility with continuous pressure data across its network can identify zones where pressure is chronically higher than necessary, install or adjust pressure reducing valves to lower it and monitor the effect in real time. Pressure management does not just reduce current leakage. It extends the service life of ageing infrastructure and defers the capital investment needed to replace it.
As documented in the IWA Publishing guide by Farley and Trow, studies in UK water networks have demonstrated burst rate reductions of 20 to 40% following systematic pressure management programmes guided by continuous pressure monitoring data.
One infrastructure, two data streams
The case for continuous pressure monitoring is strong. But its practical implementation has historically been complicated by a familiar challenge. Every new sensor is another piece of infrastructure to deploy, power, communicate and integrate into a data management system.
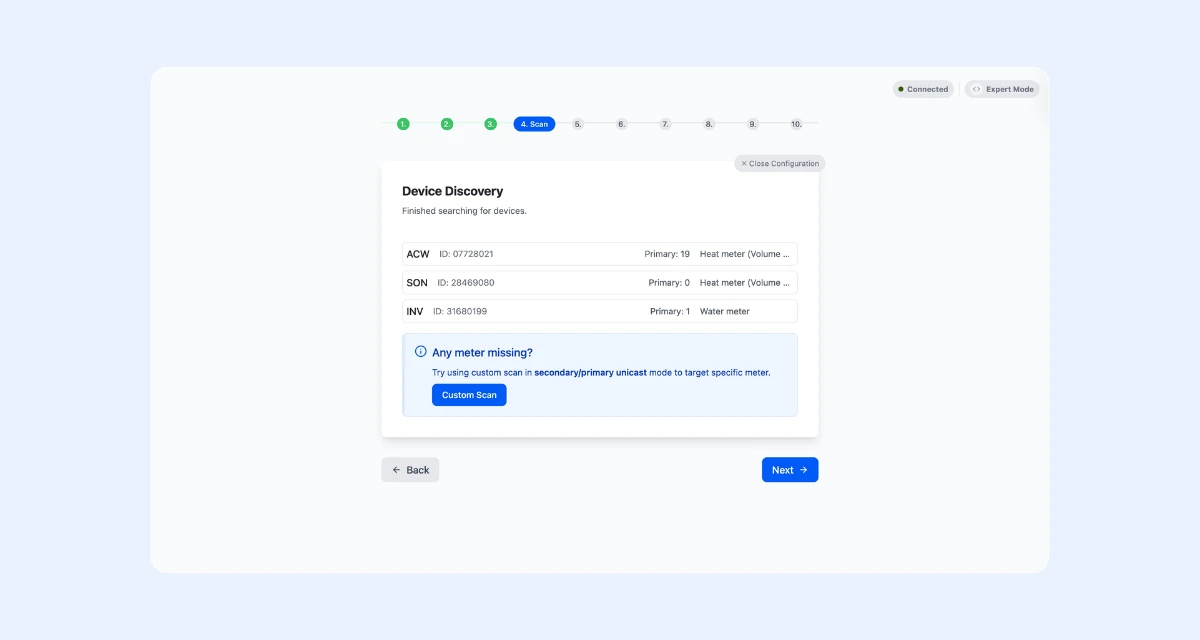
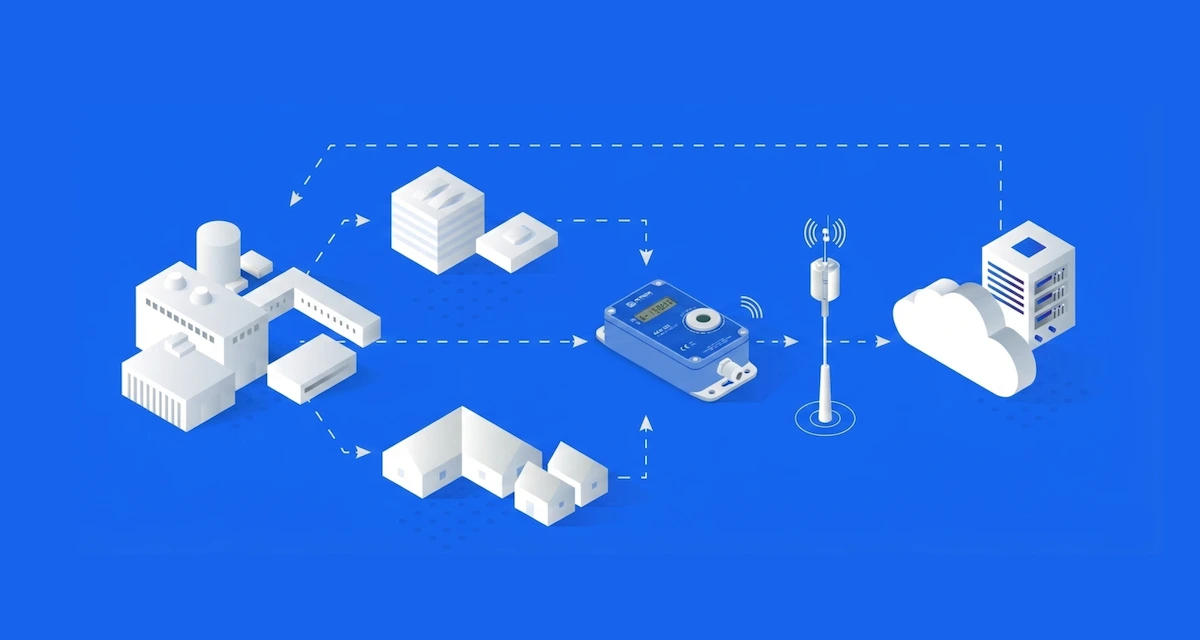
What if the pressure sensor did not need to be a separate system? What if it could share the communication infrastructure already being deployed for smart water metering, speaking the same protocol, reaching the same data platform and managed through the same interface?
FAQs
From data to solution
In the final article in this series, we look at exactly that. A combined solution that integrates pressure monitoring into the M-Bus communication infrastructure of modern water meters, transmitted over LoRaWAN or NB-IoT, to deliver a single, unified view of flow and pressure across the network.

Blog

Developing adaptive IoT communication under the CRA
Focused supplier or large vendor? Depends on the project

Edge computing in IoT metering

Manufacturer as a technology partner

Why a device without an antenna fails

CE certification for IoT: What RED DA changes

Water losses in utility networks: The hidden cost of leaks

M-Bus pressure sensor: Leak detection for water utilities

The cost of measurement data errors and how to prevent them

Smart Readiness Indicator (SRI): All you need to know
M-Bus installation tool Wizard from ACRIOS

Coulomb meter: Everything you need to know
ACR-EX in water utilities: remote reading of pulse water meters

ACRIOS and Quectel announce partnership

External or internal? How custom development works

Proven deployment of 10,000 wM-Bus converters for EED

Choosing a remote reading system for water utilities

Open data interfaces pay off for reporting and integration

15-minute vs daily meter readings frequency explained

Scripting in IoT: Flexibility, sustainability, and protection

Gas meter data to dashboard: ACR-EX meets Datacake

EPBD is coming: what BACS means for your building

When DTLS makes sense. Know before you deploy

Not your keys, not your hardware

868 MHz or 433 MHz? The right choice for your wM-Bus

Everything you need to know, documented. ACRIOS wiki.

End-to-end custom hardware and software development

How to collect energy data to support ISO 50001

Lowering IoT TCO through smart manufacturing

Reading Sensus meters with zero hardware changes

Why 15-minute data matters in district heating

Give me a tool that works. Not a manual.

5 most common myths about remote meter reading

Battery-powered vs wired: What really costs more?

Cyber Resilience Act and IoT hardware

Next-gen meter readings, no replacements needed

Modernising metering infrastructure

M-Bus to IoT integration explained

Understanding TCO: More than just hardware

NB-IoT technology: All you need to know

LoRaWAN: All you need to know

M-Bus, wM-Bus, and RS-485: A technology guide

LoRaWAN vs. NB-IoT: Which technology is right for you?

Smart metering: What it is and why it matters

IoT: Technology that saves time and money