M-Bus pressure sensor: Leak detection for water utilities

3/3 | Unified meter and pressure sensor communication: a new approach to smart water networks. The final article in a three-part series on waterlosses in distribution networks and how to reduce them, produced in cooperation between ACRIOS Systems and Lorenz GmbH & Co. KG. The previous articles addressed the causes of non-revenue water and methods of fault detection; this one introduces the concrete solution we have developed together.
The problem, restated, and an opportunity
The previous articles in this series established two things. First, non-revenue water is one of the most significant operational and financial challenges facing water utilities globally, driven primarily by physical leakage from ageing and stressed distribution infrastructure.
Second, continuous pressure monitoring is one of the most effective tools available for early fault detection, network optimisation and reducing the time between a leak starting and a utility knowing about it.
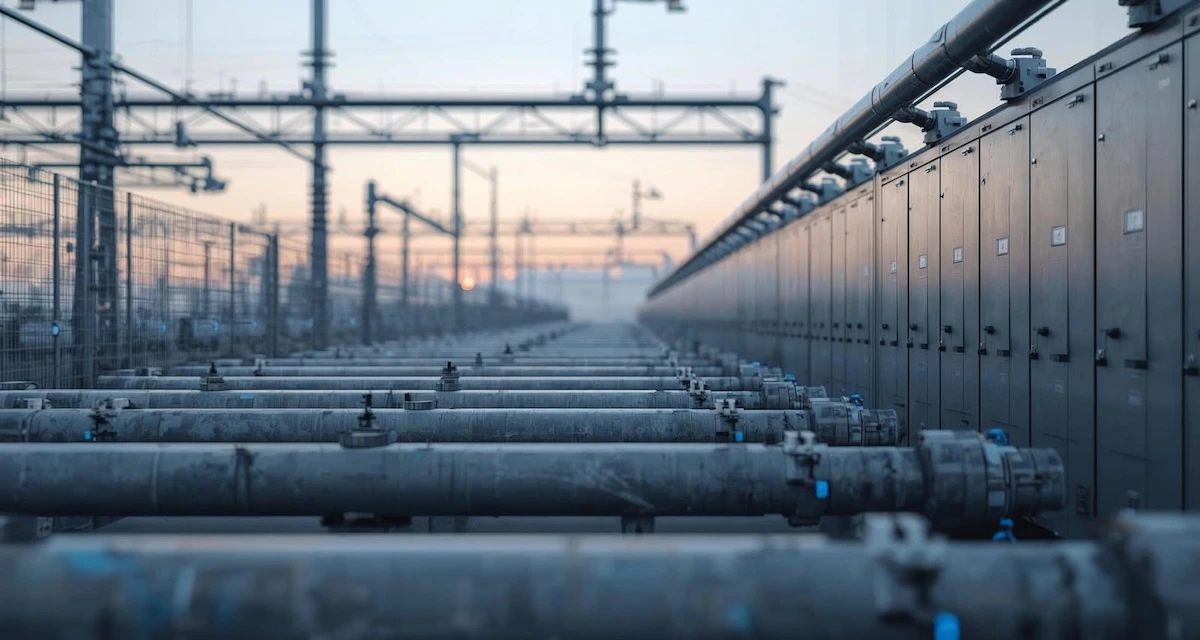
The remaining challenge is implementation. Deploying pressure sensors across a distribution network, if treated as a standalone infrastructure project, means separate devices, separate communication paths, separate data platforms and separate maintenance workflows. For many utilities, particularly smaller ones operating with constrained budgets and IT capacity, that complexity is a barrier.
The approach we have developed with Lorenz addresses that barrier directly. We integrate pressure measurement into the same communication infrastructure already used by modern smart water meters.
Lorenz: A proven foundation in water metering
Lorenz GmbH & Co. KG has a long track record in water metering, covering both residential meters and larger volumetric meters for bulk and industrial applications. Their portfolio includes the Octave ultrasonic water meter, part of the Arad Group's range of large-format smart meters designed for integration into advanced metering infrastructure and automated meter reading systems.
These meters support M-Bus communication, a standardised wired protocol widely adopted across Europe for remote reading of utility meters. M-Bus is well established, well understood by utility operations teams and supported by a broad ecosystem of data concentrators, head-end systems and integration middleware.
For a utility deploying Lorenz meters, the M-Bus infrastructure is already there. Wiring, concentrators and a data path to a central platform are in place. The question is whether more can be done with that infrastructure.
The innovation: Adding pressure to the M-Bus
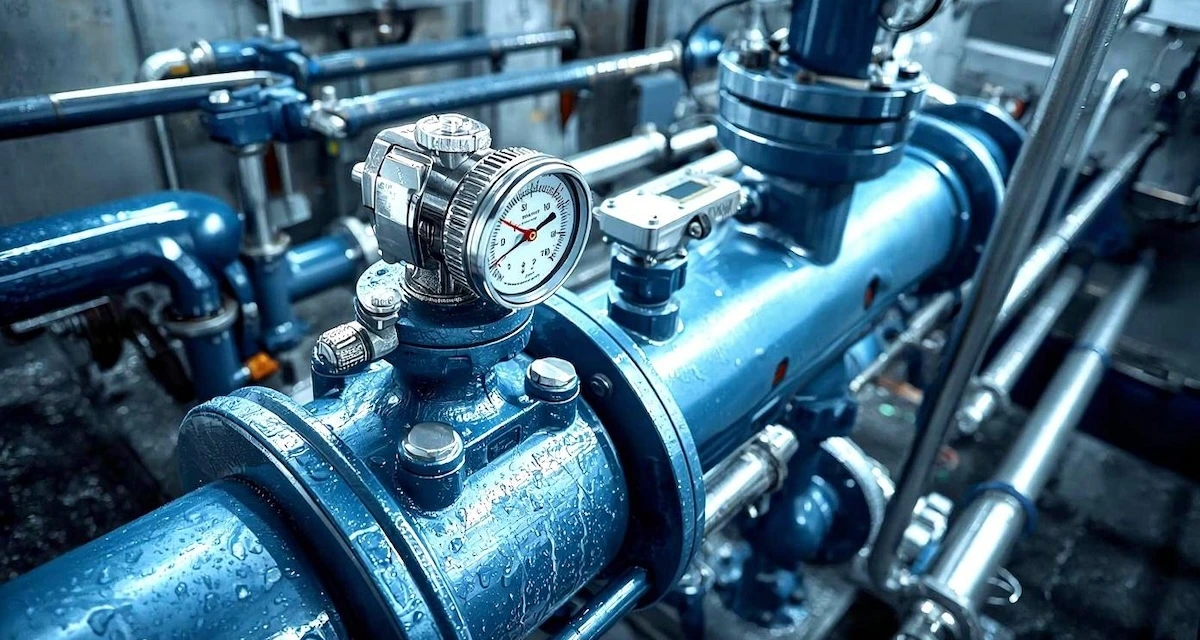
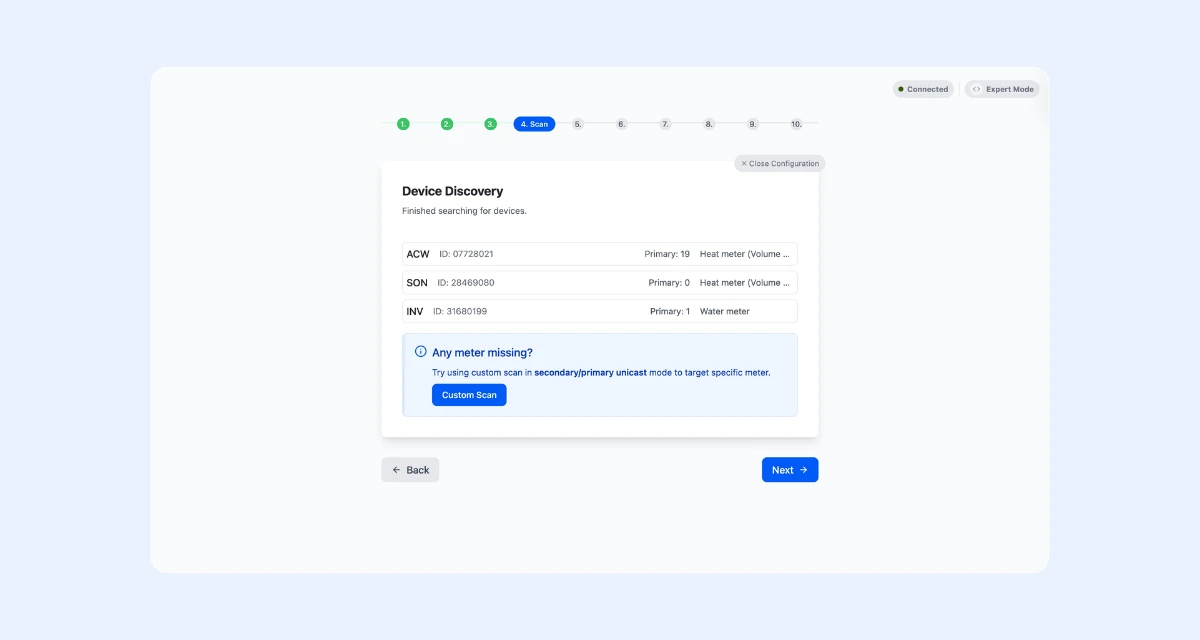
ACRIOS solution is a converter that bridges water pressure sensors to the M-Bus network. The device takes the analogue or digital output of a standard pressure transducer, a sensor already widely used in water network monitoring applications, and translates it into M-Bus telegrams formatted identically to those produced by the water meter.
From the perspective of the data concentrator, the head-end system and the backend platform, the pressure sensor becomes just another meter on the bus. It has an M-Bus device address. It sends periodic readings. It can be polled on demand. It appears in the same data stream, in the same format, as the water consumption data from the Lorenz meter sitting on the same section of pipe.
The result is a single M-Bus carrying both water consumption readings and pressure data. No separate communication infrastructure, no additional integration effort, no parallel data platform.
We demonstrated this integrated solution at the Tiefbau Forum, where it generated significant interest from utilities seeking to modernise their leak detection capabilities.
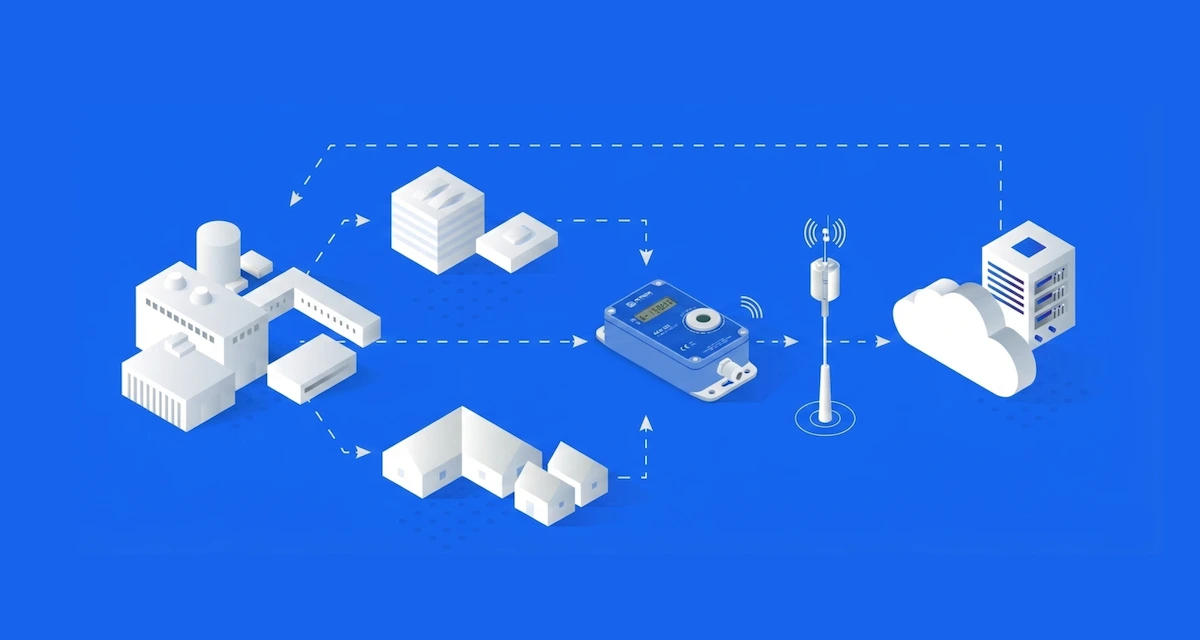
System architecture: from sensor to backend
The complete solution follows a layered architecture that is consistent with current smart metering practice and proven in large-scale deployments.
Field level
A Lorenz water meter, either residential or Octave ultrasonic, connects to the M-Bus. A pressure transducer connects to the same M-Bus via our converter.
Concentrator level
A wireless M-Bus or wired M-Bus concentrator polls both devices on a configurable cycle, typically every 15 minutes to hourly for routine monitoring, with event-driven transmission for threshold alerts.
Wide-area network level
The concentrator transmits data over LoRaWAN or NB-IoT. These low-power wide-area network technologies are now the standard communication layer for smart metering deployments at scale across Europe.
Backend level
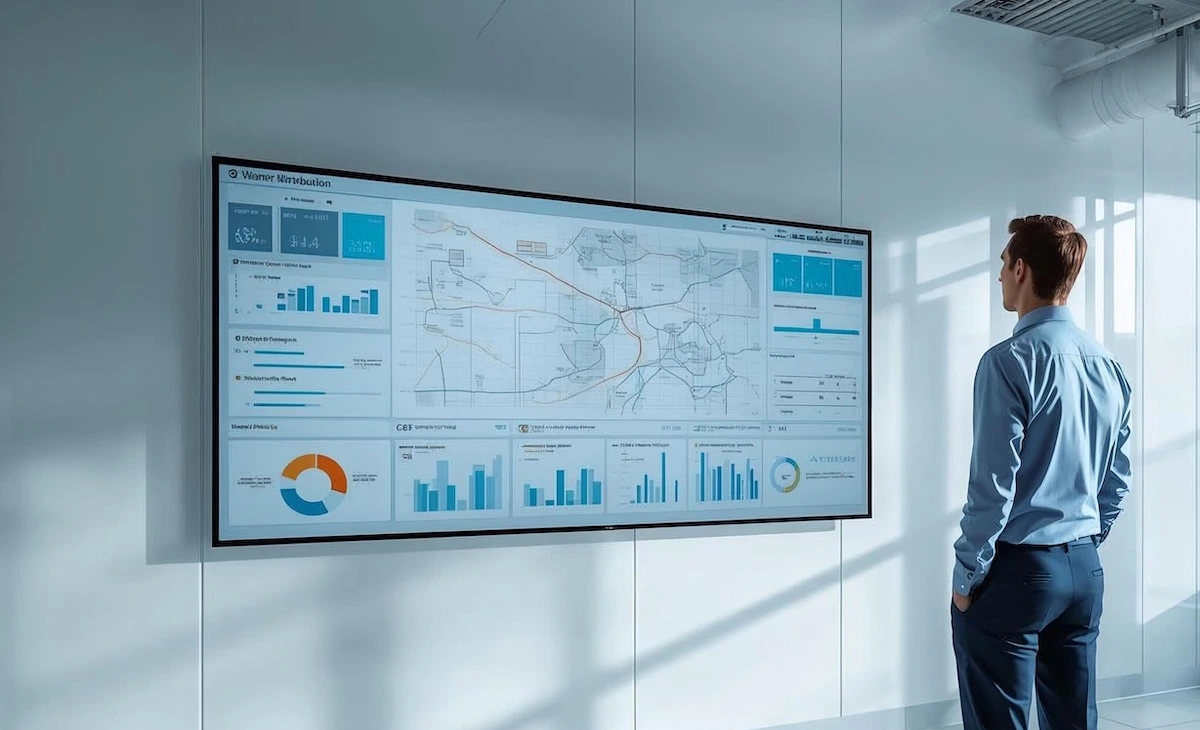
Data arrives at a central platform in a unified format, where it can be visualised, analysed and integrated with GIS, SCADA and asset management systems.
This architecture is not theoretical. Large-scale implementations demonstrate its viability. As announced in an August 2025 press release, Yorkshire Water has deployed over 1.3 million smart water meters communicating over LoRaWAN in partnership with Netmore Group, one of the largest such programmes in the UK. The infrastructure model we use is aligned with these industry-leading deployments.
What this means for a water utility
The practical benefits of deploying the combined Lorenz meter and pressure monitoring solution operate at several levels.
Faster fault detection
With pressure data arriving continuously from fixed monitoring points across the network, utilities can detect anomalies in near real time. Sudden drops, transient spikes and gradual baseline shifts all become visible immediately.
The combination of flow data from the meter and pressure data from the sensor at the same network location provides a much richer diagnostic picture than either source alone. A drop in pressure accompanied by an unexplained increase in registered flow is a strong indicator of a local leak. A drop in pressure without a corresponding flow change suggests a leak further upstream.
Reduced non-revenue water
Earlier detection means shorter leak durations, which means less water lost per event. Over a network of monitoring points, the cumulative reduction in NRW can be substantial. Combined with pressure optimisation, using the continuous data to identify and reduce zones of excessive pressure, the solution attacks NRW from two directions simultaneously.
Data-driven asset management
Persistent pressure data provides a historical record of hydraulic conditions at each monitoring point. This record is directly useful for asset management. Zones with frequent transients or elevated baseline pressure can be flagged as higher risk for future failures. This enables preventive renewal to be prioritised on the basis of evidence rather than age alone.
Simplified IT and operational integration
Because pressure data arrives in the same format, over the same network and into the same platform as meter data, there is no need to manage a parallel monitoring system. Operations teams work with a single interface. IT teams integrate one data stream. The total cost of ownership of the monitoring infrastructure is lower and the organisational burden of managing it is reduced.
Illustrative example: Early detection in practice
To illustrate the potential impact, consider a mid-sized utility managing a network of approximately 800 km of mains, with an estimated NRW rate of 28%. Following the deployment of combined meter and pressure monitoring units at 120 strategic points across the network, selected based on DMA boundaries, pressure zone transitions and historically problematic pipe sections, the utility's operations centre begins receiving continuous pressure telemetry alongside existing AMR consumption data.
Within the first four weeks of operation, three anomalies are flagged by the system's threshold-based alerting. Investigation of the first two reveals small but persistent leaks at corroded service connections, leaks that would likely not have been detected for several months under the previous reactive maintenance regime. The third alert, a repeated pressure transient at a pumping station outlet, leads to reconfiguration of the pump start sequence, addressing a source of ongoing pipe fatigue.
Over a twelve-month period, the average time from leak initiation to detection falls from an estimated 45 days to under 72 hours for faults near monitoring points. The utility's annual NRW figure, adjusted for network renewal also underway during this period, shows a measurable decline. And the pressure data forms the evidential basis for a targeted pipe renewal programme in two high-loss zones.
Note: the above scenario is illustrative, drawing on realistic parameters consistent with published utility experience. Specific outcomes will vary based on network characteristics, monitoring density and operational processes.
The direction of travel
The digitisation of water distribution networks is not a future trend. It is happening now, driven by regulatory pressure, water security concerns and the falling cost of communication technology. Smart meters are being deployed at scale across Europe and beyond. The infrastructure to transmit, collect and analyse data from those meters already exists or is being built.
The logical next step is to make that infrastructure do more. Adding pressure monitoring to the same M-Bus and LoRaWAN infrastructure as the smart meter does not require a new platform, a new communication layer or a new operational workflow. It requires a converter, a device that speaks the language the network already understands.
That is what we at ACRIOS have built, together with Lorenz. And it is available now.

FAQs
Let's get in touch
If you are exploring options for pressure monitoring, NRW reduction or smart metering infrastructure for your network, we would welcome a conversation. Contact us to discuss your network's specific characteristics and how a combined metering and pressure monitoring solution could work for you.

Blog

Developing adaptive IoT communication under the CRA
Focused supplier or large vendor? Depends on the project

Edge computing in IoT metering
Manufacturer as a technology partner

Why a device without an antenna fails

CE certification for IoT: What RED DA changes

Water losses in utility networks: The hidden cost of leaks
Pressure monitoring in water networks: Early fault detection

The cost of measurement data errors and how to prevent them

Smart Readiness Indicator (SRI): All you need to know
M-Bus installation tool Wizard from ACRIOS

Coulomb meter: Everything you need to know
ACR-EX in water utilities: remote reading of pulse water meters

ACRIOS and Quectel announce partnership

External or internal? How custom development works

Proven deployment of 10,000 wM-Bus converters for EED

Choosing a remote reading system for water utilities

Open data interfaces pay off for reporting and integration

15-minute vs daily meter readings frequency explained

Scripting in IoT: Flexibility, sustainability, and protection

Gas meter data to dashboard: ACR-EX meets Datacake
EPBD is coming: what BACS means for your building

When DTLS makes sense. Know before you deploy

Not your keys, not your hardware
868 MHz or 433 MHz? The right choice for your wM-Bus
Everything you need to know, documented. ACRIOS wiki.

End-to-end custom hardware and software development
How to collect energy data to support ISO 50001

Lowering IoT TCO through smart manufacturing

Reading Sensus meters with zero hardware changes

Why 15-minute data matters in district heating

Give me a tool that works. Not a manual.

5 most common myths about remote meter reading

Battery-powered vs wired: What really costs more?

Cyber Resilience Act and IoT hardware

Next-gen meter readings, no replacements needed

Modernising metering infrastructure

M-Bus to IoT integration explained

Understanding TCO: More than just hardware

NB-IoT technology: All you need to know

LoRaWAN: All you need to know

M-Bus, wM-Bus, and RS-485: A technology guide

LoRaWAN vs. NB-IoT: Which technology is right for you?

Smart metering: What it is and why it matters

IoT: Technology that saves time and money