ILI: what the EU leakage threshold measures
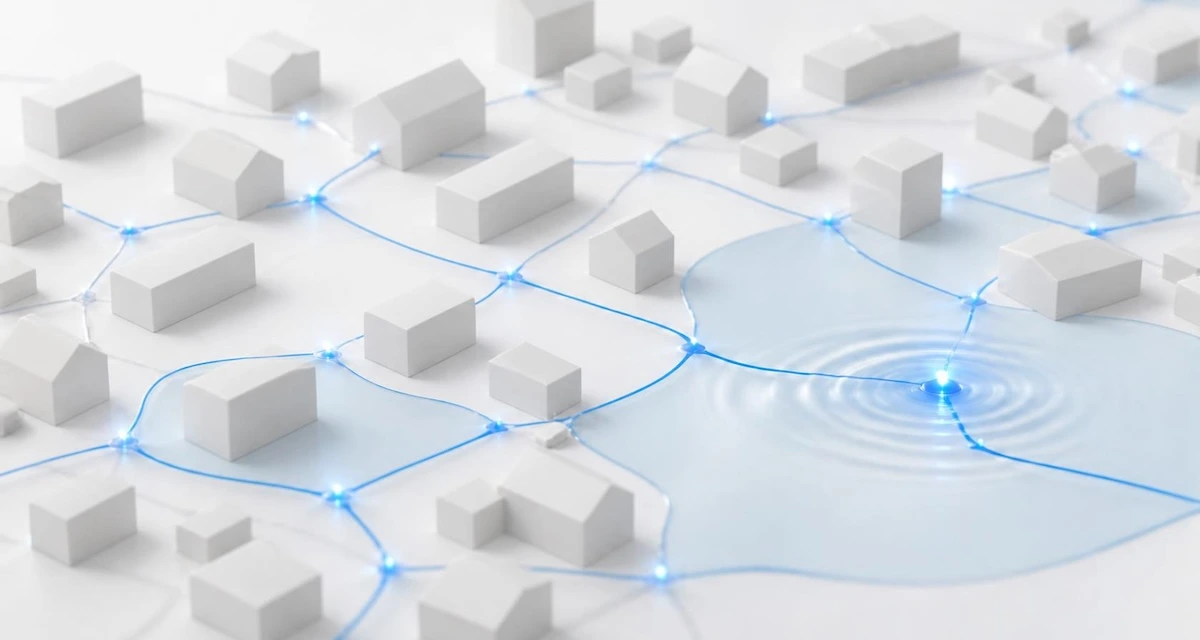
What the EU leakage threshold measures, and which network data it depends on
Expressing water losses as a percentage has one important limitation: the figure changes with consumption. If consumption rises while the volume of water lost stays the same, the percentage falls, even though nothing in the network has changed. The Infrastructure Leakage Index (ILI) offers a way to assess network performance that does not depend on consumption, and the EU is preparing a leakage threshold that will bring greater attention to how these losses are measured.
As Europe moves towards a systematic assessment of water losses, the volume lost will not be the only question that matters. Equally important will be how reliably a utility can quantify its losses, compare them, and identify where intervention makes sense.
Key takeaways
- The Infrastructure Leakage Index (ILI) is the ratio of Current Annual Real Losses (CARL) to Unavoidable Annual Real Losses (UARL). It shows how far real losses in a network are above the technically unavoidable minimum for that network.
- The Drinking Water Directive (EU) 2020/2184 requires Member States to assess leakage levels using the ILI rating method or another appropriate method, covering at least water suppliers that supply 10,000 m³ per day or serve 50,000 people.
- Member States had to communicate their assessments by 12 January 2026. The Commission must set a threshold by 12 January 2028, and Member States above it must present an action plan within two years of its adoption.
- Loss figures expressed as a percentage of system input change with consumption so that they can improve on paper without any change in the volume of water lost.
- A credible ILI requires a sound water balance, accurate infrastructure data and representative pressure data. District metered areas and night flow analysis help identify zones to prioritise for leakage investigation.
- Remote meter reading and continuous pressure monitoring do not repair leaks, but they help utilities identify where repairs and renewal may have the greatest impact.
What ILI measures
ILI compares two volumes. CARL, Current Annual Real Losses, is the volume of water a network actually loses through physical leakage in a year. UARL, Unavoidable Annual Real Losses, is the volume that would be lost even in a well-maintained network operated to good technical standards, because no network is perfectly tight.
UARL is calculated with a formula published by the International Water Association (IWA):
UARL (litres per day) = (18 × Lm + 0.8 × Nc + 25 × Lp) × P
Lm is the length of mains in kilometres, Nc the number of service connections, Lp the total length of private pipe between the property boundary and the customer meter in kilometres, and P the average operating pressure in metres.
The formula gives UARL in litres per day. Before calculating ILI, CARL and UARL must be expressed over the same period and in the same units. The formula was derived from data on a defined range of networks, and published guidance sets conditions for its use, such as system size, connection density and pressure range. Consider its applicability and the quality of the input data, particularly when comparing networks with different operating conditions.
ILI is CARL divided by UARL. An ILI of 1 means real losses are at the unavoidable level for that network. An ILI of 4 means they are four times higher. The index's strength is that it accounts for network length, connection density, and pressure, so a large rural network and a compact urban one can be compared on a more equal basis.
Why the Drinking Water Directive refers to ILI
Directive (EU) 2020/2184 on the quality of water intended for human consumption, often called the recast Drinking Water Directive (DWD), addresses leakage in Article 4(3). Member States must ensure that they assess leakage levels on their territory and the potential to reduce them using the ILI rating method or another appropriate method.
The assessment must take into account public health, environmental, technical, and economic aspects, and cover at least water suppliers that supply at least 10,000 m³ per day or serve at least 50,000 people.
The wording matters. The directive does not make ILI the only permitted method, but it is the only method named. To support consistent reporting, the Commission’s drinking water expert group developed a water leakage level template, presented in June 2025, which Member States could use for their communication.
The timeline: from assessment to threshold
The directive sets out the sequence in three steps:
- by 12 January 2026, Member States communicate the results of their leakage assessment to the Commission.
- by 12 January 2028, the Commission is required to adopt a delegated act setting a threshold based on ILI or another appropriate method.
- within two years of adopting that delegated act, Member States with a leakage rate above the threshold must present an action plan with measures to reduce it.
These obligations are addressed to Member States, not directly to individual water utilities. National authorities decide how to translate them into requirements for suppliers. In practice, however, national assessments rely on data from the utilities themselves.
For water utilities, this timeline creates a practical planning window. The threshold is not yet known, but the need for reliable leakage assessments already is. Improving the quality of network data before the threshold is adopted may be more useful than waiting for a number to compare against.
A new political signal from the State of the Union
On 16 September 2026, Commission President Ursula von der Leyen addressed water losses directly in her State of the Union speech. She noted that European pipes lose almost one in every four litres, mostly through leakage, and announced a new European Water initiative.
The initiative's scope has not yet been specified. Even so, leakage has shifted from a technical reporting obligation to a stated political priority, making the 2028 threshold harder to treat as a distant formality.
NRW in percent versus ILI
Most utilities and most public debates still describe water losses as non-revenue water (NRW) expressed as a percentage of system input volume. The figure is easy to communicate, but it has two weaknesses.
First, NRW is broader than leakage. It includes real losses, apparent losses such as metering inaccuracies and unauthorised use, and unbilled authorised consumption. A percentage figure does not show which of these drives the result.
Second, a percentage moves with consumption. Take a network with 1 million m³ of annual real losses and a system input volume of 4 million m³: real losses equal 25% of system input. If consumption rises and system input reaches 5 million m³ while leakage stays the same, the share falls to 20%. Nothing has improved in the pipes. The same effect applies to NRW expressed as a percentage. For this reason, the American Water Works Association stated in 2019 that it could not recommend percentage NRW as a performance indicator.
ILI avoids this effect because it compares real losses with what the specific network could achieve, not with how much water customers happen to use. It is not a perfect metric, and it is sensitive to input quality. That sensitivity is exactly where data becomes the deciding factor.
What data a utility needs to calculate ILI
An ILI value may look precise, but its reliability depends on the measurements and assumptions behind it. Before comparing networks or planning investments, a utility needs to understand where its real-loss estimate comes from and how accurately it describes its infrastructure and operating conditions. Three groups of data matter most.
- Water balance: system input volume, billed and unbilled authorised consumption and an estimate of apparent losses. Real losses, and therefore CARL, are what remains once these are accounted for
- Infrastructure data: length of mains, number of service connections and length of private pipe up to the customer meter, the inputs for UARL
- Average operating pressure: a direct input for UARL, and the variable that most affects how much water leaks
A network-wide water balance shows how much is lost, but not where. That is the practical value of district metered areas (DMAs): dividing the network into zones with measured inflow makes it possible to compare losses zone by zone.
The minimum night flow, the lowest inflow into an area during the night, consists mainly of legitimate night use and leakage, which makes it one of the most widely used indicators for estimating real losses. Combined with pressure measurements and an estimate of legitimate night use, night flow analysis helps identify zones where further leakage investigation should be prioritised.
Where remote reading and pressure sensors fit
A water balance compares what enters the network with what customers consume over the same period. Manual readings taken at different dates make that comparison approximate.
Remote meter reading delivers time-stamped consumption data for the metering points it covers so that consumption can be aligned more closely with system input for the same interval. The benefit grows with coverage, but even a deployment limited to selected DMAs improves the data for those zones and makes anomalies at individual meters visible sooner.
Pressure data plays a double role. It is an input for UARL, and continuous monitoring shows how pressure behaves across the day, at night, and during transients. The series on water losses produced by ACRIOS and Lorenz examines the causes of leakage, compares early-fault-detection methods, and describes how an M-Bus pressure sensor can share the same communication layer as smart water meters.
On the communication side, existing wired M-Bus meters and sensors can be connected to remote reading over NB-IoT or LoRaWAN through ACRIOS converters, without building a parallel network.
Data before pipes
Reducing leakage ultimately means repairing and renewing pipes, and no amount of data replaces that work. Acute leaks and bursts must be repaired immediately, and good network management combines measurement, maintenance, and renewal rather than doing them one after another.
What data changes is the quality of the decisions. Pipe renewal is expensive and slow, and the 2028 threshold will be assessed on a calculated index, not on kilometres of new pipe. A utility with a credible water balance, representative pressure data and zone-level night flows can show where its ILI comes from and focus renewal budgets on the zones that appear to contribute most to real losses. A utility without that data risks an ILI distorted by uncertain inputs, or investment in zones that were not the main source of losses.
From the ACRIOS perspective, data before pipes is not about postponing repairs. It is about helping utilities make better-informed decisions about where to invest in leakage reduction and how to assess and demonstrate the results as EU leakage reporting requirements develop.

Glossary of terms used
- Apparent losses: water consumption that is not correctly measured or accounted for because of meter inaccuracies, data handling errors or unauthorised use
- CARL (Current Annual Real Losses): the volume of water actually lost through physical leakage in a distribution network in one year
- Delegated act: a legal act adopted by the European Commission to supplement or amend non-essential parts of an EU directive or regulation
- District metered area (DMA): a defined part of a distribution network with monitored water flows at its boundaries, used to assess consumption and losses within the zone
- Infrastructure Leakage Index (ILI): the ratio of Current Annual Real Losses to Unavoidable Annual Real Losses, with both expressed over the same period
- Minimum night flow: the lowest inflow into a network area during the night, consisting mainly of legitimate night use and leakage
- Non-revenue water (NRW): the difference between the volume of water entering a distribution system and billed authorised consumption
- Real losses: physical water losses caused by leaks and bursts in pipes, joints, fittings and storage tanks
- UARL (Unavoidable Annual Real Losses): the volume of real losses that would occur even in a well-maintained network, calculated from mains length, number of connections, private pipe length and average pressure
- Water balance: a structured comparison of the volume of water entering a network with authorised consumption and losses over the same period
FAQs
Preparing for the EU leakage threshold starts with reliable consumption and pressure data from the network. We can assess which existing meters and sensors can be connected to remote reading and how the data can support the water balance.

Blog
Pulsed water meter: All you need to know
LoRaWAN airtime: why radio conditions matter
Converter, bus, bridge, gateway: what's the difference?
What actually drains an IoT device battery
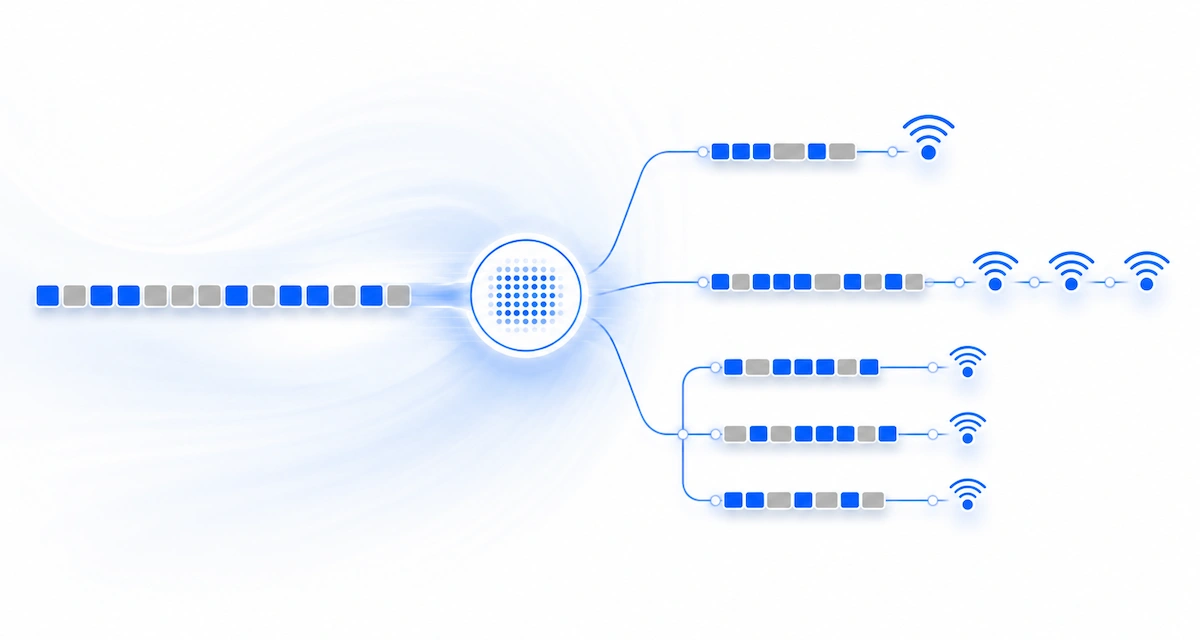
M-Bus parsing strategies for LoRaWAN and NB-IoT
How to best replace walk-by meter reading
Can your existing meters be retrofitted?

Battery life in IoT: beyond the datasheet number
Agile, Waterfall, or NRE? Choosing a development methodology
Developing adaptive IoT communication under the CRA
Focused supplier or large vendor? Depends on the project

Edge computing in IoT metering
Manufacturer as a technology partner

Why a device without an antenna fails

CE certification for IoT: What RED DA changes
Water losses in utility networks: The hidden cost of leaks
Pressure monitoring in water networks: Early fault detection
M-Bus pressure sensor: Leak detection for water utilities
The cost of measurement data errors and how to prevent them

Smart Readiness Indicator (SRI): All you need to know
M-Bus installation tool Wizard from ACRIOS
Coulomb meter: Everything you need to know
ACR-EX in water utilities: remote reading of pulse water meters

ACRIOS and Quectel announce partnership

External or internal? How custom development works

Proven deployment of 10,000 wM-Bus converters for EED
Choosing a remote reading system for water utilities
Open data interfaces pay off for reporting and integration
15-minute vs daily meter readings frequency explained

Scripting in IoT: Flexibility, sustainability, and protection

Gas meter data to dashboard: ACR-EX meets Datacake
EPBD is coming: what BACS means for your building
When DTLS makes sense. Know before you deploy

Not your keys, not your hardware
868 MHz or 433 MHz? The right choice for your wM-Bus
Everything you need to know, documented. ACRIOS wiki.
End-to-end custom hardware and software development
How to collect energy data to support ISO 50001

Lowering IoT TCO through smart manufacturing
Reading Sensus meters with zero hardware changes

Why 15-minute data matters in district heating
Give me a tool that works. Not a manual.

5 most common myths about remote meter reading

Battery-powered vs wired: What really costs more?

Cyber Resilience Act and IoT hardware
Next-gen meter readings, no replacements needed

Modernising metering infrastructure

M-Bus to IoT integration explained
Understanding TCO: More than just hardware
NB-IoT technology: All you need to know
LoRaWAN: All you need to know

M-Bus, wM-Bus, and RS-485: A technology guide

LoRaWAN vs. NB-IoT: Which technology is right for you?
Smart metering: What it is and why it matters

IoT: Technology that saves time and money